


Data and Coffee Quality Framework by Kenya coffee school and Barista Mtaani
KCS-ABCVA™ Global Cupping Standard
Scoring Form with Forest Cover Analysis
Farm Location Analysis
Click on the map to select a farm location
Latitude: –
Longitude: –
Forest Cover (250m radius):
–
Economic Score: –
Forest data based on ESA WorldCover 2020
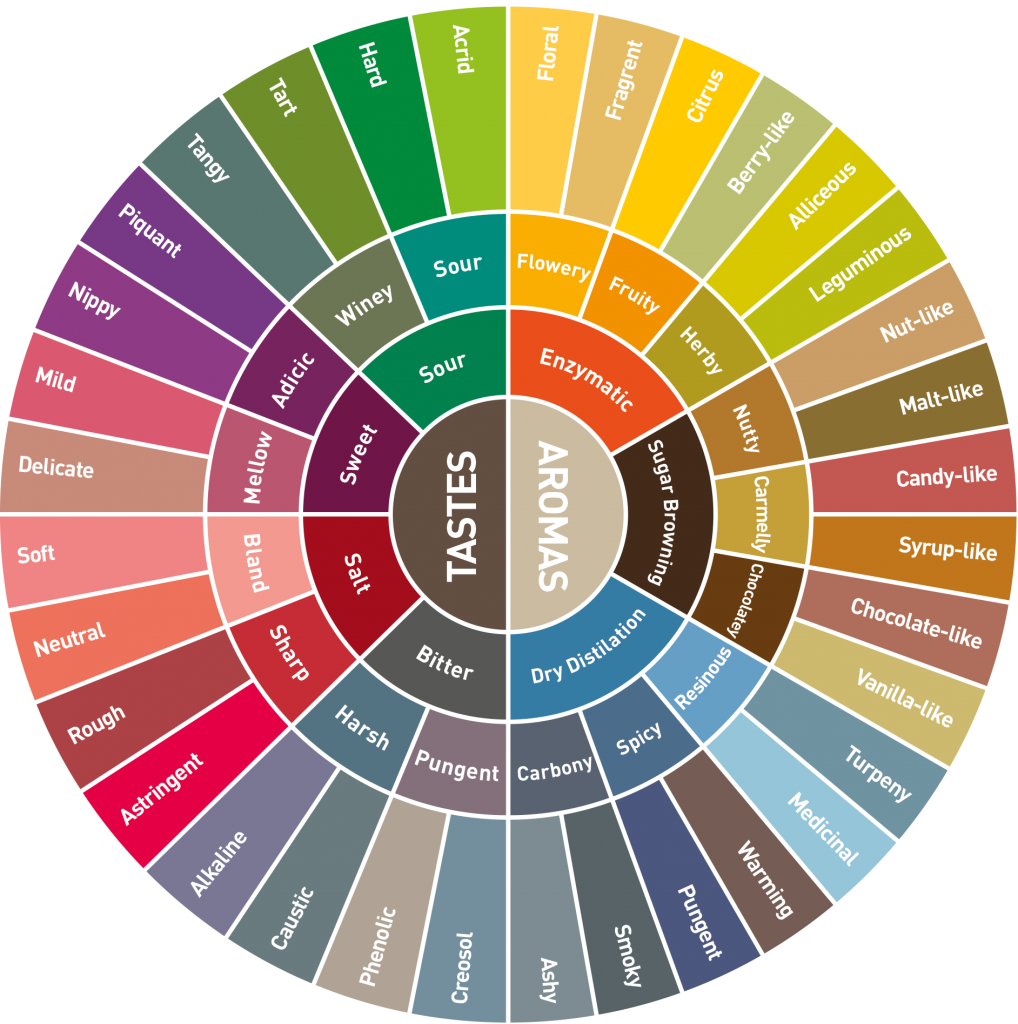
AROMATICS: Sensorial (S) — max 40
| Aromatic Axis | Score (0–4) | Notes |
|---|---|---|
| Fragrance / Aroma | ||
| Flavor | ||
| Aftertaste | ||
| Acidity | ||
| Body | ||
| Balance | ||
| Sweetness | ||
| Uniformity | ||
| Clean Cup | ||
| Overall |
S (Sensorial): 0 / 40
ECONOMIC / TRACEABILITY (E) — max 30
This value is automatically calculated based on forest cover analysis
CHARACTER / INTEGRITY (C) — max 30
FINAL SCORE = 0 / 100
How it works:
- Click on the map to select a farm location
- The system analyzes forest cover within a 250m radius
- Economic score is automatically calculated based on forest percentage
- Fill in the Sensorial and Character scores
- Final score is calculated automatically
Forest Cover to Economic Score Conversion:
- ≥ 60% forest → 30 points
- 40-59% forest → 25 points
- 20-39% forest → 20 points
- 10-19% forest → 10 points
- < 10% forest → 0 points
Farm Location Analysis
Click on the map to select a farm location
Latitude: -
Longitude: -
Forest Cover (250m radius):
-
Economic Score: -
Forest data based on ESA WorldCover 2020 (Simulated)
KCS-ABCVA™ Global Cupping Standard — Scoring Form
AROMATICS: Sensorial (S) — max 40
| Aromatic Axis | Score (0–4) | Notes |
|---|---|---|
| Fragrance / Aroma | ||
| Flavor | ||
| Aftertaste | ||
| Acidity | ||
| Body | ||
| Balance | ||
| Sweetness | ||
| Uniformity | ||
| Clean Cup | ||
| Overall |
S (Sensorial): 0 / 40
ECONOMIC / TRACEABILITY (E) — max 30
This value is automatically calculated based on forest cover analysis
CHARACTER / INTEGRITY (C) — max 30
FINAL SCORE = 0 / 100
How it works:
- Click on the map to select a farm location
- The system analyzes forest cover within a 250m radius (Simulated)
- Economic score is automatically calculated based on forest percentage
- Fill in the Sensorial and Character scores
- Final score is calculated automatically
Forest Cover to Economic Score Conversion:
- $ge$ 60% forest $to$ 30 points
- 40-59% forest $to$ 25 points
- 20-39% forest $to$ 20 points
- 10-19% forest $to$ 10 points
- $<$ 10% forest $to$ 0 points


